Cubit 15.8 User Documentation
In order to effectively visualize the model, it is often necessary to draw an entity by itself, or several entities as a group. This is easily done with the command
Draw {Entity specification} [Color <color_spec>] [Zoom] [Add]
where Entity specification is an entity list as described in Command Line Entity Specification. This command clears the display before drawing the specified entity or entities. Specification of a color will draw those entities in that color. This will not permanently change the color of the entity. The zoom option will zoom in on the selected entities after drawing them in the graphics window. If the add option is specified, the display is not cleared, and the given entity is added to what is already drawn on the screen. The entities specified in this command are drawn regardless of their visibility setting (see Geometry and Mesh Entity Visibility for more details about visibility).
Entities may also be drawn by selecting them with the mouse and then typing Ctrl-D while the mouse is in the graphics window. This will clear the screen and then draw only those entities that are currently selected.
Entities can be highlighted using the command
Highlight {Entity specification}
This command highlights the specified entities in the current display with the current highlight color. Highlighting can be removed using the command
Graphics Clear Highlight
To return to the normal display of the entire model, type Display.
The Locate command will label and point to the specified entity or location in the graphics window. The command syntax is:
Locate <entity_list>
Locate <location options>
For example, suppose you have an idless reference to a curve of:
Curve ( at 5 5 0 ordinal 1 )
You can find the curve with the following command:
locate location 5 5 0
Additionally, the visibility of individual entities, or sets of entities, can be controlled with the following visibility commands.
{Vertex|Curve|Surface|Volume|Body|Group} <range> [Geometry|Mesh] Visibility {on|off}
Edge [Visibility] {on|off}
{Mesh|Geometry} [Visibility]{on|off}
In addition to the common geometry, mesh and genesis entities, other objects may be drawn with variations of the Draw command. As with the other Draw commands, typing Display after drawing these objects will restore the scene to its normal display.
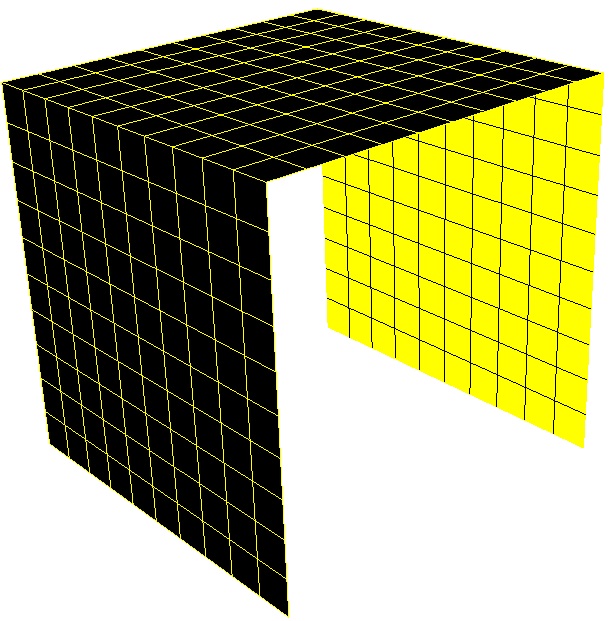
The normal to one or more surfaces, mesh faces, or mesh triangles may be drawn with the command
Draw {Surface | Face | Tri} <id_range> Normal [Length <length>] [Face | Tri] Color <color> [Add]
Surface normal command colors the surfaces using two different colors. The surface exposed to the positive half space (i.e, along the direction of normal), will always be colored black. The surace exposed to the negative half space will be colored using the specified <color>.
If the Face or Tri qualifier is included in the Draw Normal command, the normals for all faces or tris that belong to the specified surface are drawn.
Arrow representing the normal will be displayed if "Length" is specified
The forward, or tangent, direction of a curve can be drawn with the command:
Draw Curve <id_range> Tangent [Length <length>][Color <color_spec>]
If a color is not specified, the tangent is drawn in the same color as the curve.
Once the source and target surfaces have been set on a volume that will be meshed with the sweep algorithm, the source and target may be visually identified with the command
Draw Volume <volume_id_range> [Source][Target] [Length <size>]
If the Source keyword is included, the normal of the source surface or surfaces will be drawn in green into the specified volume. If the Target keyword is included, the normal of the target surface or surfaces will be drawn in red into the specified volume.
The model axis may be drawn with the command
Draw Axis [Length <length>]
The axis is drawn as three lines beginning at the model origin, one line in each of the three coordinate directions. The length of those lines is determined by the length parameter, which defaults to 1.
Isoparameter lines may be drawn on surfaces in the model using the command
Draw Surface <surface_id_range> Isoparametric [Number <number>| [u <number>] [v <number>]]
If you specify the Number of lines, then the number of u- and v-parameter lines will be equal. You may specify instead a number of lines for each of the u and v parameters. The u-parameter lines will be drawn in red and the v-parameter lines will be drawn in blue.
The overlapping regions between two surfaces may be drawn with the command
Draw Surface <id> <id>Overlap [Add]
This command will draw the curves of each of the surfaces in green, and the portion of the surfaces that overlap in red. The Add keyword will draw the overlapping surfaces on top of the current graphics display. Without the Add keyword, the display will only show the specified surfaces and their overlapping regions.
The overlapping region between two volumes may be drawn with the command
Draw Volume <id> <id> Overlap [Add]
This command will draw the input volumes in transparent mode and draw the volume(s) of intersection as red, shaded solids. The Add keyword will draw the results on top of the current graphics display. Without the Add keyword, the display will only show the specified volumes along with the intersection volume(s).